


Chapter 01
What crypto market participants should know
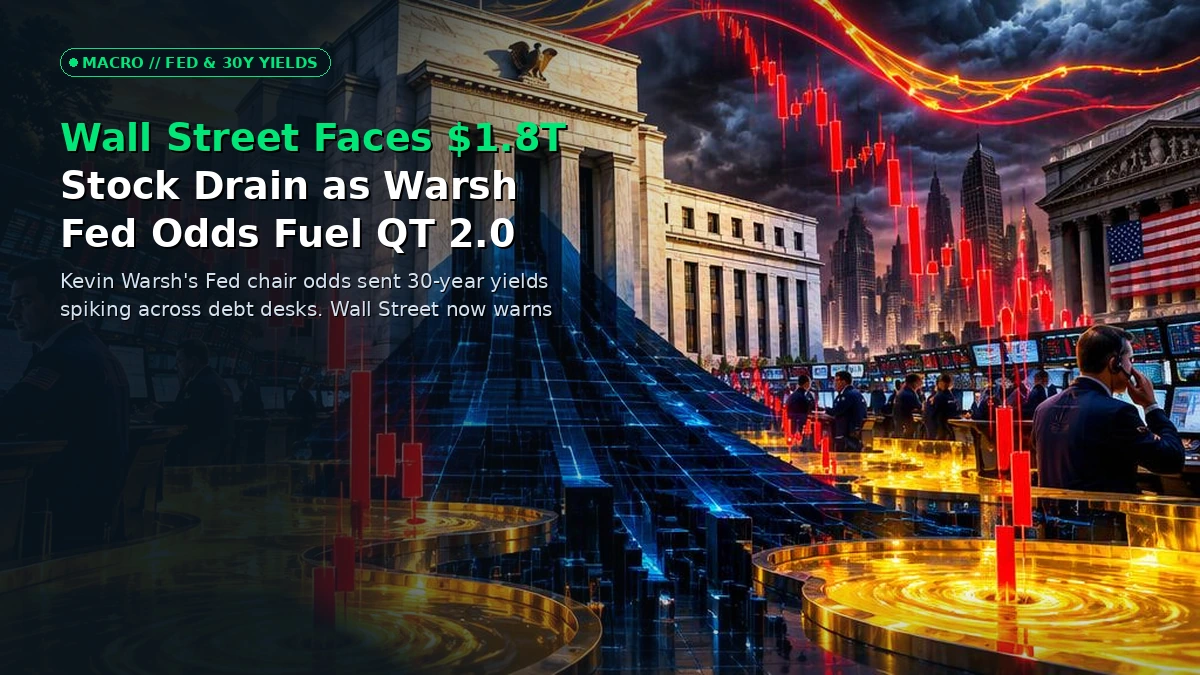
The emergence of former Federal Reserve Governor Kevin Warsh as the frontrunner for central bank leadership has sent a profound shockwave through Wall Street debt capital desks and equity trading floors alike. As bond yields surge across the curve and the 30-year Treasury yield tests critical macroeconomic ceilings—a dynamic explored extensively in CNBC's bond market coverage—trading desks are urgently recalibrating for a structural shift in monetary governance. The immediate casualty of this structural shift is the broader equity market, where aggressive anti-balance-sheet doctrines threaten to drain up to $1.8 trillion in excess system liquidity. High-beta S&P 500 equities and richly valued technology multiples are absorbing the brunt of the repricing, reacting violently to the prospect of a severe, accelerated Quantitative Tightening (QT 2.0) cycle. Risk remains elevated across all institutional equity trends on the stocks and tokenized assets desk.
This impending liquidity squeeze strikes at a time of extreme market vulnerability, highlighted by an S&P 500 equity risk premium that has compressed to a 22-year low of just 0.45%. With risk-free Treasury yields climbing rapidly, the historical buffer that equities enjoyed against fixed-income alternatives has evaporated, leaving over-leveraged institutional portfolios exposed to sudden structural reallocations. Compounding this systemic risk is the rapid depletion of the Federal Reserve’s overnight reverse repo (RRP) facility, which has dwindled near its critical $100 billion structural floor, as documented in official Federal Reserve balance sheet trends. As traditional safe-haven assets offer competing yields and central bank balance sheet runoff accelerates, Wall Street strategists warn that the liquidity cushions that protected risk assets throughout previous cycles are officially gone. For broader coverage on how macroeconomic shifts impact digital assets and traditional risk markets, head over to our latest market wires. The shift was immediate.
Chapter 02
The Core Catalyst: Warsh's Anti-Balance-Sheet Doctrine and QT 2.0
To understand the profound anxiety gripping Wall Street trading floors, one must dissect the intellectual lineage and policy philosophy of Kevin Warsh. Unlike traditional central bankers who view large-scale asset purchases and permanent balance sheet expansions as standard monetary policy tools, Warsh has long been a vocal critic of quantitative easing and inflated central bank assets, a tension analyzed in depth by CNBC's macro policy reporting. His prospective appointment signals an immediate pivot toward shrinking the Federal Reserve's footprint, an objective that market participants have dubbed "QT 2.0." This initiative is not merely a continuation of the previous passive runoff program; it represents an aggressive, front-loaded effort to purge excess reserves from the banking system and restore true price discovery to the front end of the yield curve. Markets reacted swiftly.
The mechanical reality of QT 2.0 centers on the potential acceleration of Fed balance sheet runoff targeting up to $1.8 trillion in excess system liquidity. As the central bank allows maturing Treasuries and mortgage-backed securities to roll off without reinvestment, commercial bank reserves are systematically drained. This withdrawal of base money forces banks to compete more aggressively for scarce liquidity, driving up overnight funding rates and cascading across corporate credit and equity markets. When liquidity contracts at this magnitude, the marginal buyer of equities—particularly leveraged retail participants and corporate share-buyback desks—finds themselves starved of the cheap funding that fueled previous multi-year bull runs. Execution remains paramount.
Simultaneously, the mechanics of this liquidity drain are colliding with structural shifts in government debt issuance. With the U.S. Treasury continuing to issue record volumes of debt to finance structural fiscal deficits, the absorption capacity of primary dealers is being severely tested. As debt supply swamps market demand, long-end yields surge, dragging mortgage rates, corporate borrowing costs, and consumer credit yields higher. Institutional desks tracking these fixed-income dislocations are increasingly moving capital away from speculative equities, routing flows into safer, high-yielding short-duration paper. For those balancing portfolios across both traditional equities and digital assets, building upon earlier findings in our recent analysis on Brent Crude Surge and Yield Spikes Test Bitcoin's Risk-Asset Core, utilizing secure hardware crypto wallets remains a vital defense mechanism against broader macroeconomic volatility and exchange counterparty risk. Caution dictates strategy.
Chapter 03
Macro Transmission & Historical Precedents: How This Compares to Prior Cycles
When evaluating the current tightening cycle against historical precedent, Wall Street analysts are quick to draw parallels to the 2018-2019 "quantitative tightening on autopilot" era under Jerome Powell, which famously provoked a sharp fourth-quarter equity drawdown and forced a premature policy pivot. However, market veterans note that the current setup under a prospective Warsh regime could be significantly more aggressive, combining balance sheet contraction with structurally higher neutral interest rates. In past cycles, such as the initial post-pandemic recovery or even recent analysis on Abu Dhabi Deploys $1.2B Sovereign Bitcoin Mining Fleet Powered by Barakah Nuclear Energy, ample liquidity and negative real yields acted as a perpetual safety net for risk assets. Today, that safety net has been completely removed by structural inflation dynamics and persistent fiscal expansion. Capital preserves optionality.
The transmission mechanism from the bond market to equities is currently operating at maximum velocity. As benchmark 10-year and 30-year Treasury yields break higher, the discount rate applied to future corporate cash flows shifts upward, disproportionately punishing long-duration technology stocks and growth companies. This dynamic mirrors the painful valuation compression witnessed during the aggressive rate-hike campaigns of 2022, but with an added twist: the banking system is no longer cushioned by the trillion-dollar buffers of the overnight reverse repo facility. With RRP balances hovering near the $100 billion structural floor, any further liquidity drain will feed directly into commercial bank reserves, tightening credit conditions across the board. Volatility persists.
For market participants attempting to navigate these treacherous macro crosscurrents, understanding the interplay between traditional liquidity metrics and digital asset correlation is increasingly critical. While Bitcoin and major altcoins occasionally trade as high-beta risk proxies, structural liquidity shocks affect every asset class differently. Traders looking to execute tactical hedges or rebalance their portfolios during periods of systemic stress can compare execution venues and fee structures across audited crypto exchanges to ensure optimal capital efficiency. Additionally, monitoring liquidity flows through Bitcoin newsdesk and Altcoins & ecosystems provides essential context on how decentralized markets are absorbing macro shocks relative to traditional equity benchmarks.
Chapter 04
Market Contagion, Liquidity Rotation & Microstructure Breakdown
The cross-asset contagion resulting from surging Treasury yields and the Warsh Fed shadow is manifesting clearly in equity market microstructure. As the S&P 500 equity risk premium touches a 22-year low of 0.45%, stocks are offering virtually zero compensation for the underlying volatility of corporate earnings relative to risk-free cash. This compressed risk premium is triggering a massive institutional liquidity rotation out of equities and into fixed-income instruments. Systematic equity strategies, risk-parity funds, and quantitative volatility-targeting models are being forced to de-lever simultaneously as realized volatility ticks upward, creating a self-reinforcing downward pressure on stock prices.
Market depth across major equity indices has thinned noticeably, exacerbating intraday price swings and leaving order books vulnerable to sharp flash-crashes. Algorithmic market makers are widening their bid-ask spreads to account for heightened macroeconomic uncertainty regarding the future path of Federal Reserve leadership and balance sheet policy. This microstructure breakdown is not isolated to Wall Street; it directly impacts retail and institutional investors alike who rely on stable execution environments.
| Metric / Indicator | Previous / Baseline | Current Level | Tactical Market Implication |
|---|---|---|---|
| S&P 500 Equity Risk Premium | ~2.50% (Historical Avg) | 0.45% (22-Year Low) | Severe overvaluation of equities relative to risk-free debt; capital rotation into fixed income. |
| Fed Overnight RRP Facility | $2.5 Trillion (Peak 2022/2023) | Near $100 Billion Floor | Complete exhaustion of system liquidity buffers; balance sheet runoff now directly drains bank reserves. |
| 30-Year Treasury Yield | Sub-4.00% (Prior Cycle) | Multi-Year Resistance Tests | Higher discount rates crushing long-duration growth equities and expanding corporate borrowing costs. |
| Target QT 2.0 Liquidity Drain | $95B / month passive runoff | Up to $1.8 Trillion Accelerated | Heightened systemic funding stress and potential credit contraction across commercial lending desks. |
"We are witnessing the end of the post-GFC liquidity illusion," notes a senior head of macro strategy at a major Tier-1 New York investment bank. "When the equity risk premium compresses to 45 basis points while a prospective Fed chair openly champions an aggressive balance sheet purge, the entire institutional playbook of buying every dip must be rewritten. Fixed income is finally a viable alternative, and equities are no longer the only game in town."
Chapter 05
Institutional Order Flow & Whale Accumulation Dynamics
Beneath the headline indices, institutional order flow paints a picture of intense defensive positioning and capital preservation. Derivative desks report a surge in demand for downside equity protection, with put-to-call ratios climbing sharply as institutional asset managers hedge against a potential breakdown in market structure. Large-scale block trades are increasingly weighted toward defensive sectors, utilities, and consumer staples, while high-multiple software, semiconductor, and speculative tech shares experience persistent, institutional distribution. Whale accounts and macro hedge funds are systematically unwinding leveraged long exposures, opting instead for cash-equivalent yields and short-duration sovereign debt.
In the digital asset sphere, institutional order flow via spot exchange-traded funds (ETFs) has similarly reflected broader macroeconomic jitters. While spot Bitcoin and Ethereum ETFs experienced explosive inflows during periods of anticipated monetary easing, the current environment of surging bond yields and tightening liquidity has introduced noticeable friction. Institutional allocators are carefully weighing the opportunity cost of holding non-yielding digital assets against risk-free Treasuries yielding near or above 5%. Consequently, ETF daily net flows have turned choppy, alternating between sharp inflows during temporary dips and significant outflows as macro risk-off sentiment takes hold.
Despite these macro headwinds, long-term on-chain metrics suggest that core holders and corporate treasuries remain steadfast, prioritizing self-custody and cold storage solutions over exchange speculation. Investors accumulating digital assets for the long haul continue to withdraw coins from centralized platforms into offline hardware crypto wallets, insulating their holdings from exchange-level counterparty risks and sudden regulatory shifts. For those actively managing day-to-day liquidity and seeking to spend crypto gains in the real world without dealing with cumbersome exchange off-ramp fees, utilizing specialized crypto debit cards offers a seamless bridge between digital wealth and everyday purchasing power.
Chapter 06
What Happens Next: The Two Trading Scenarios
As Wall Street grapples with the dual pressures of an aggressive Fed leadership transition and relentless fiscal debt issuance, market participants must model two divergent macro scenarios for the quarters ahead.
In the first scenario—the Bullish Soft-Landing & Pivot Reversal—inflation metrics cool faster than anticipated, allowing the Federal Reserve (even under a disciplined chair like Kevin Warsh) to temper its balance sheet reduction before core system reserves are severely damaged. In this outcome, the S&P 500 holds its critical technical support floors, tech multiples stabilize as earnings beat conservative guidance, and equity risk premiums begin to widen naturally as risk-free yields moderate. Risk assets, including digital tokens, experience a relief rally as institutional capital returns to growth sectors, bolstered by clearer regulatory frameworks and resilient corporate balance sheets.
In the second and more dangerous scenario—the Bearish Liquidity Crunch & QT 2.0 Shock—the overnight RRP floor is completely breached, forcing severe funding stress across commercial banking and repo markets. Under this aggressive tightening trajectory, the 30-year Treasury yield breaks decisively higher, crushing corporate credit markets and forcing a violent de-leveraging event across equity indices. The S&P 500 breaches major structural support levels, high-beta growth stocks experience severe multiple compression, and systemic margin calls trigger forced liquidations across both traditional and alternative asset classes. In this environment, cash and short-duration sovereign paper remain the ultimate safe havens.
Chapter 07
The Bottom Line for Market Participants
- Actionable Takeaway 1: Rebalance portfolio risk exposures immediately by reducing high-beta equity concentrations and reviewing duration risk across fixed-income holdings in light of surging 30-year Treasury yields.
- Actionable Takeaway 2: Monitor institutional liquidity indicators, specifically tracking Federal Reserve reverse repo (RRP) balances and commercial bank reserve levels for signs of systemic funding stress.
- Actionable Takeaway 3: Safeguard capital by migrating long-term digital asset holdings off centralized trading platforms and into secure hardware crypto wallets to mitigate counterparty risk.
- Actionable Takeaway 4: Optimize execution costs and compare platform security features across audited crypto exchanges and verified product comparisons before deploying tactical capital into volatile spot or derivative markets.
Chapter 08
Frequently Asked Questions
Question 1?
What makes Kevin Warsh’s stance on the Federal Reserve balance sheet uniquely threatening to current equity valuations? Kevin Warsh has consistently advocated for a much smaller Federal Reserve footprint, arguing that massive central bank balance sheets distort price discovery, encourage excessive financial risk-taking, and blur the lines between monetary and fiscal policy. Unlike passive balance sheet runoff programs that allow assets to mature gradually, Warsh's doctrinal framework favors active, accelerated asset sales and a much leaner balance sheet. For equity markets that have relied on trillions of dollars in excess system liquidity to inflate multiples—particularly since the post-pandemic era—this aggressive tightening doctrine removes the foundational support mechanism that has kept the S&P 500 elevated despite rising macroeconomic headwinds.
Question 2?
How does an S&P 500 equity risk premium at a 22-year low of 0.45% impact institutional asset allocation? The equity risk premium (ERP)—the excess return that investing in the stock market provides over a risk-free rate—has compressed to an extreme low of 0.45%. Historically, institutional investors demand a much higher buffer to compensate for the inherent volatility and earnings risk of equities relative to holding risk-free government bonds. With Treasury yields surging and the ERP compressed near zero, holding equities no longer provides adequate compensation for the underlying risk. This mathematical reality is driving institutional capital out of risk assets and into fixed-income instruments, triggering systemic portfolio reallocations and multi-sector equity sell-offs.
Question 3?
What is the significance of the overnight reverse repo (RRP) facility approaching its $100 billion structural floor? The overnight reverse repo facility acted as a massive liquidity sponge and safety buffer for the financial system following the pandemic stimulus era, holding over $2.5 trillion at its peak. As this facility has been steadily drained by Treasury issuances and quantitative tightening, it has approached a critical structural floor near $100 billion. The significance is simple: once the RRP buffer is entirely exhausted, any further balance sheet runoff or Treasury debt issuance must be funded directly out of commercial bank reserves. This transition immediately tightens bank lending standards, drains system liquidity, and elevates the probability of sudden funding stress in overnight repo markets.
Question 4?
How should digital asset investors and crypto traders position themselves amid mounting macro liquidity pressures? Macro liquidity shocks inevitably cascade across all risk assets, including cryptocurrencies. When central banks drain liquidity and bond yields surge, speculative digital assets often experience heightened volatility and correlation with high-beta equities. To navigate these turbulent conditions, market participants should maintain strict risk management discipline, avoid excessive leverage, and prioritize self-custody by moving long-term holdings into cold storage. Additionally, utilizing verified audited crypto exchanges for active trading and exploring crypto debit cards for real-world off-ramping can help investors maintain operational flexibility while protecting their capital against systemic shocks.
Question 5?
What are the primary macro catalysts to watch over the coming quarters to determine whether QT 2.0 triggers a severe market crash? Investors and analysts must closely monitor three key indicators over the coming months: first, the trajectory of the 30-year Treasury yield and whether it breaches critical long-term resistance levels; second, weekly Federal Reserve balance sheet updates to track the exact velocity of reserve drainage once RRP balances reach zero; and third, corporate earnings guidance and credit spread widening in high-yield corporate debt markets. If credit spreads begin to blow out concurrently with surging bond yields and declining bank reserves, it will signal that the QT 2.0 liquidity shock is successfully transmitting from the banking sector into the broader real economy, validating the bearish market contagion scenario.