

Chapter 01
What crypto market participants should know
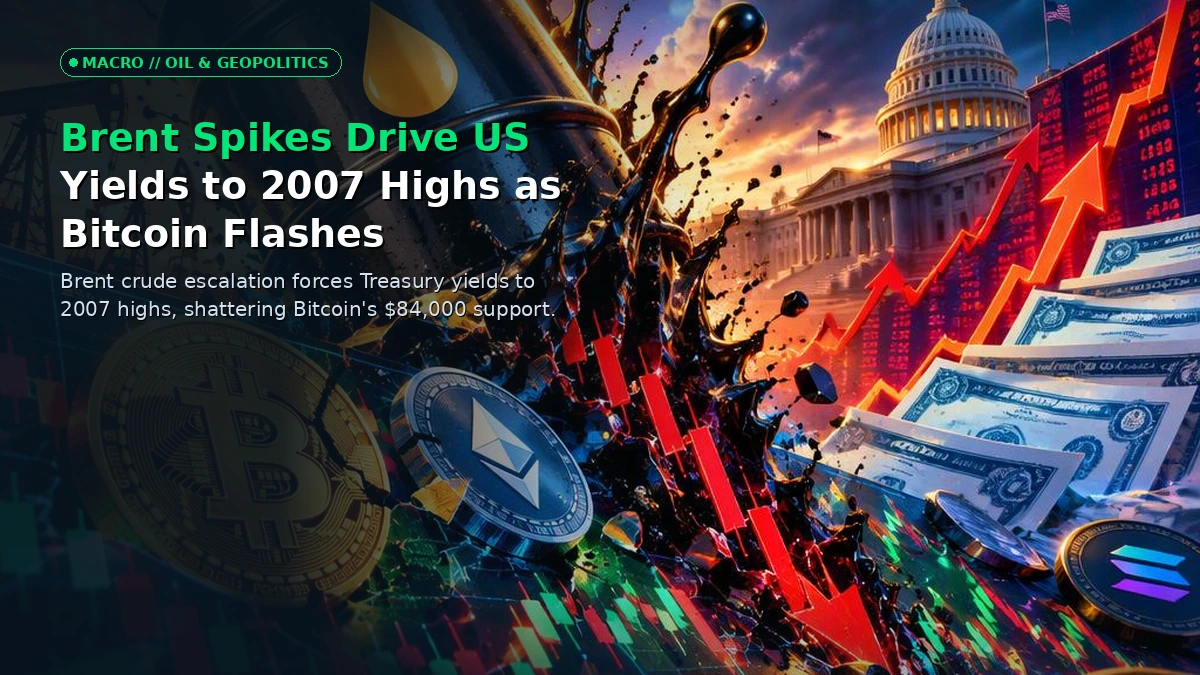
As Brent crude benchmarks fluctuate sharply amid heightened Persian Gulf maritime security concerns, global macroeconomic desks are experiencing a profound structural tremor that is rippling directly into digital asset books. As explored across institutional equity trends on the stocks and tokenized assets desk, Bitcoin, which recently hovered near the psychological $84,000 threshold as a broader bond selloff paused, is facing an acute identity crisis. Rather than acting as an uncorrelated, sovereign "digital gold" safe haven against Middle East kinetic friction, the premier cryptocurrency's price action continues to exhibit tight, high-beta correlations with traditional equity risk assets, as highlighted in recent analysis on Brent Spikes Drive US Yields to 2007 Highs as Bitcoin Flashes Safe-Haven Failure Below $84K. The confluence of surging energy prices, a strengthening US Dollar Index (DXY), and stubborn multi-decade high Treasury yields has rapidly constrained speculative risk capital across global exchanges, setting up a high-stakes collision between macro liquidity and crypto market structure. Risk remains elevated.
This friction point is squeezing leveraged derivative traders, high-frequency liquidity providers, and institutional allocators alike as collateral requirements tighten and funding rates recalibrate. The catalyst is not an isolated crypto-native deleveraging event, but rather a classic macro squeeze: energy-induced inflation shocks feeding directly into sticky central bank interest rate expectations. As institutional desks re-price portfolio risk, digital assets are increasingly treated as high-beta growth proxies rather than uncorrelated monetary hedges. For readers tracking these shifting monetary fault lines, our Bitcoin newsdesk and latest market wires provide real-time updates. the structural implications demand a full breakdown into how energy markets dictate crypto liquidity. The shift was immediate.
Chapter 02
The Core Catalyst: Persian Gulf Chokepoints and the Yield Curve Shock
The immediate vector of transmission from the Middle East to global crypto order books runs through the energy complex and the US Treasury market. As maritime transit tensions escalate in the Persian Gulf and Red Sea corridors, Brent crude benchmarks have experienced violent intraday swings. Energy market participants are aggressively pricing in supply-chain risk premiums, driving up fuel costs and threatening a global secondary wave of goods-inflation. This localized geopolitical conflict immediately translates into a global macroeconomic headache because higher crude prices act as a direct tax on industrial activity and consumer purchasing power, forcing central banks to maintain restrictive monetary stances for longer than speculative markets anticipated. Markets reacted swiftly.
This macro reality has sent shockwaves through the US Treasury yield curve, with long-end yields testing multi-decade highs. For Bitcoin and the broader digital asset ecosystem, rising sovereign yields represent a direct compression of the global liquidity multiplier. When risk-free yields climb above 4.5% to 5%, the opportunity cost of holding non-yielding, volatile assets like cryptocurrencies spikes exponentially. Speculative capital that once flowed freely into high-beta altcoins and spot Bitcoin exchange-traded products is reallocated toward risk-free sovereign debt and cash equivalents. Consequently, order book depth across major audited crypto exchanges has thinned, leaving spot prices acutely vulnerable to aggressive algorithmic selling and waterfall liquidations whenever macro data prints hotter than expected. Execution remains paramount.
The transmission mechanism is further exacerbated by the behavior of corporate treasuries and institutional balance sheets. Firms that previously embraced digital assets as an inflation hedge find themselves caught in a liquidity squeeze where corporate borrowing costs track the broader bond market selloff. When corporate cost of capital rises, balance sheet optimization requires de-risking volatile inventory. As a result, the structural bid that sustained digital asset markets through previous quarters has moderated, forcing traders to re-evaluate whether Bitcoin’s core narrative as a decentralized safe-haven asset can withstand an aggressive global liquidity contraction driven by energy shocks. Caution dictates strategy.
Chapter 03
Macro Transmission & Historical Precedents: How This Compares to Prior Cycles
To understand the severity of the current macro squeeze, one must examine how Bitcoin’s market structure has evolved across previous geopolitical and monetary cycles. During the 2020 halving cycle and the early pandemic monetary expansion, crypto assets operated in an environment of hyper-abundant fiat liquidity. When central banks flooded the global financial system with quantitative easing, Bitcoin functioned as a high-beta sponge for excess cash, decoupling from traditional risk assets during specific phases of monetary debasement. However, the maturation of the asset class—accelerated by the massive institutional inflows following spot ETF approvals—has fundamentally altered its correlation profile. Capital preserves optionality.
By 2026, the influx of traditional financial market participants, algorithmic macro funds, and pension-adjacent capital has bound Bitcoin’s short-term destiny to traditional equity indexes like the S&P 500 and Nasdaq 100. When energy shocks trigger a flight to cash and short-duration Treasuries, algorithmic trading desks execute cross-asset risk-reduction programs that automatically trim crypto holdings alongside tech stocks. This dynamic mirrors the 2022 Federal Reserve rate-hiking cycle, where aggressive monetary tightening crushed speculative asset valuations. The key difference today is the sheer scale of institutional infrastructure: derivatives markets are deeper, institutional custody is more pervasive, and macro hedge funds actively trade Bitcoin as a liquid proxy for global liquidity conditions. Volatility persists.
additionally, the current regulatory and structural landscape introduces new nuances. While policymakers debate frameworks like the implementation of the Genius Act for stablecoins to regulate digital dollar issuance as covered by CoinDesk, market participants must navigate a bifurcated reality. On one hand, stablecoin supply serves as the primary liquidity fuel for crypto exchanges; on the other hand, traditional banking sector stress, driven by bond portfolio unrealized losses, occasionally spills over into fiat-to-crypto gateway rails. For those navigating these turbulent waters, diversifying across licensed crypto exchanges and maintaining strict risk parameters is no longer optional—it is a mandatory survival strategy.
Chapter 04
Market Contagion, Liquidity Rotation & Microstructure Breakdown
The secondary effects of the Brent crude surge and Treasury yield spike are clearly visible in crypto derivatives microstructure. Perpetual swap funding rates, which spent months in heavily positive territory during periods of aggressive spot accumulation, have experienced sharp compressions and periodic negative flips as long positions face forced liquidation. When the cost of carry rises alongside falling spot prices, leveraged traders are forced to unwind positions, triggering cascading margin calls that sweep through order books. This localized deleveraging underscores how quickly macroeconomic fear translates into microstructural stress on exchange order matching engines.
Spot-to-derivative volume ratios have also shifted dramatically. During periods of sustained institutional buying, spot volume dominates, reflecting genuine organic accumulation. However, during energy-driven macro selloffs, derivative trading volume surges as macro funds utilize liquid crypto futures to express short-term risk-off views or hedge broader equity portfolios. This creates temporary price dislocations across various trading venues, compressing spot spreads and increasing intraday volatility.
| Metric / Indicator | Previous / Baseline | Current Level | Tactical Market Implication |
|---|---|---|---|
| Brent Crude Benchmark | Stable / Range-bound ($70-$75) | Elevated ($85+ volatile) | Triggers imported inflation fears, forcing higher bond yields. |
| US 10-Year Treasury Yield | Moderate (3.8% - 4.2%) | Testing Multi-Decade Highs | Increases risk-free opportunity cost, starving crypto of speculative capital. |
| Bitcoin Spot ETF Net Flows | Robust ($400M+/day average) | Moderated ($191M, choppy streak) | Slowing institutional intake reduces absorption capacity for spot sell-offs. |
| Perpetual Funding Rates | Consistently Positive | Compressed / Neutral-Negative | Indicates leveraged longs are exhausted; downside protection demand rises. |
Industry veterans observing these cross-asset dynamics note that the traditional boundaries separating macro commodity desks from digital asset execution are dissolving. As one prominent derivatives trading desk head remarked:
"We are no longer trading in a vacuum where crypto halves and on-chain metrics dictate price action in isolation. When crude spikes and the DXY surges, macro risk parity models dictate an automatic flushing of high-beta inventory, and Bitcoin is currently trading dead center in the crosshairs of that institutional de-risking wave."
To protect capital against such violent macro-induced drawdowns, sophisticated market participants increasingly rely on robust self-custody solutions, moving accumulated assets off trading venues into secure hardware crypto wallets to eliminate counterparty risk while positioning for the next structural cycle.
Chapter 05
Institutional Order Flow & Whale Accumulation Dynamics
Beneath the volatile surface of macroeconomic headlines and derivative liquidations, institutional order flow tells a more nuanced story of accumulation versus distribution. Recent data tracking spot Bitcoin exchange-traded funds reveals that daily net inflows have cooled significantly compared to historical record streaks, slowing to a more modest pace—such as a $191 million daily intake capping a multi-day accumulation sequence that previously totaled billions as reported by Cointelegraph. This deceleration does not signal a wholesale institutional exit; rather, it reflects a cautious pause as allocators reassess portfolio risk budgets in light of escalating Middle East tensions and bond market volatility.
Simultaneously, CME futures open interest metrics indicate that institutional participants are actively hedging their spot delta exposure rather than liquidating their core holdings entirely. Large-scale whales and corporate treasuries with multi-year investment horizons continue to defend key psychological support levels, demonstrating a reluctance to capitulate despite macro headwinds. On-chain wallet clustering data highlights significant accumulation clustering between the $80,000 and $83,000 bands, suggesting that long-term holders view current macro-driven price depressions as strategic entry points rather than structural trend reversals.
This divergence between short-term macro traders and long-term institutional hodlers creates a fascinating market equilibrium. While leveraged retail speculators and macro hedge funds drive high-frequency volatility, sticky institutional capital embedded in ETFs and multi-sig cold storage vaults acts as a powerful structural floor. For retail participants looking to interact with decentralized ecosystems or manage their daily liquidity without incurring heavy exchange withdrawal fees during high-volatility windows, utilizing modern crypto debit cards offers a seamless bridge between digital asset holdings and real-world purchasing power.
Chapter 06
What Happens Next: The Two Trading Scenarios
As the macroeconomic landscape hangs in the balance between geopolitical resolution in the Persian Gulf and stubborn central bank monetary policy, market participants must prepare for two distinct tactical scenarios over the coming quarter.
Bullish Breakout Scenario: Geopolitical De-escalation & Yield Stabilization
If diplomatic efforts in the Middle East successfully ease Persian Gulf maritime tensions, Brent crude prices could retrace rapidly toward the $75 baseline. This relief in the energy complex would instantly alleviate secondary inflation pressures, allowing the US Treasury bond market to rally with live market confirmation via CoinDesk and yields to recede from multi-decade highs. In this environment, the US Dollar Index (DXY) would face downward pressure, instantly unlocking global liquidity. Bitcoin would likely break out above key overhead resistance at $90,000, reigniting institutional ETF inflows and driving aggressive short-covering across derivatives desks. Altcoins and decentralized finance protocols would experience a violent rotation of capital as risk appetite returns in full force.
Bearish Invalidation Scenario: Energy Shock & Liquidity Crunch
Conversely, if geopolitical conflicts escalate further, driving Brent crude toward triple digits, imported inflation will force the Federal Reserve and global central banks into a hawkish corner. Treasury yields would break out to new cycle highs. the DXY would surge, draining global liquidity like a sponge. Under this scenario, Bitcoin's correlation with equity risk assets would intensify negatively, driving a breach of the crucial $80,000 psychological and technical floor. Cascading liquidations across leveraged long positions would trigger a deeper correction toward the mid-$70,000 range, testing the resolve of institutional ETF allocators and corporate balance sheet holders.
Chapter 07
The Bottom Line for Market Participants
Navigating an environment where geopolitical energy shocks collide with traditional fixed-income volatility requires strict operational discipline, robust risk management, and continuous evaluation of competing trading platforms through verified product comparisons on our crypto comparison directory. To safeguard your portfolio against macro-driven contagion, adhere to the following action items:
- Actionable Takeaway 1: Audit your current exchange exposure and migrate surplus long-term holdings into air-gapped hardware crypto wallets to completely eliminate platform counterparty risk during periods of extreme market stress.
- Actionable Takeaway 2: Monitor macroeconomic data releases—specifically Crude Inventories, CPI prints, and the US 10-Year Treasury Yield—as primary leading indicators for crypto market volatility rather than relying solely on crypto-native technicals.
- Actionable Takeaway 3: Review your derivatives leverage and margin requirements; reduce position sizes to withstand sudden 15% intraday market sweeps driven by macro algorithmic risk-off events.
- Actionable Takeaway 4: Compare fee structures and execution speeds across multiple audited crypto exchanges to ensure optimal trade execution and minimal slippage during high-volume liquidation cascades.
Chapter 08
Frequently Asked Questions
Question 1: Why does a rise in Brent crude oil prices directly impact Bitcoin prices when they are fundamentally different asset classes?
The connection between Brent crude and Bitcoin is mediated entirely through global macroeconomic liquidity and inflation expectations. When crude oil spikes due to Middle East tensions, it increases production and transportation costs globally, fueling sticky inflation. Central banks respond to this inflationary pressure by keeping interest rates elevated or signaling tighter monetary policy, which drives up US Treasury yields and strengthens the US Dollar. Because Bitcoin operates globally as a high-beta asset sensitive to liquidity conditions, rising yields increase the opportunity cost of capital, prompting institutional funds to reduce risk across all speculative asset classes simultaneously.
Question 2: Are spot Bitcoin ETFs insulating the market from macro shocks, or are they accelerating crypto's correlation with traditional equities?
Spot Bitcoin ETFs have introduced a dual dynamic into market structure. On one hand, they provide a massive, sticky institutional capital base that establishes strong structural price floors during normal market conditions. On the other hand, because these ETFs are integrated directly into traditional brokerage accounts and macro portfolio management models, they systematically tie Bitcoin's daily flow dynamics to traditional equity risk-off routines. When traditional macro funds execute risk-parity rebalancing, ETF flows reflect that institutional de-risking, thereby tightening Bitcoin's statistical correlation with the S&P 500 and Nasdaq during macro stress events.
Question 3: How should retail traders adjust their risk management strategies when Treasury yields test multi-decade highs?
When Treasury yields test multi-decade highs, the cost of capital across the entire financial system rises significantly. Retail traders must drastically reduce leverage. the probability of sudden, macro-driven liquidity crunches and cascading liquidations increases. Maintaining high cash or stablecoin reserves, lowering perpetual futures exposure, and avoiding high-beta altcoin speculation without strict stop-losses are essential defensive measures. additionally, securing assets in self-custody ensures that traders retain absolute control over their capital regardless of macro volatility or exchange solvency rumors.
Question 4: What role do stablecoins play during periods of intense macro and energy market volatility?
Stablecoins serve as the primary liquidity bridge and safe-haven asset within the digital asset ecosystem during macro downturns. When institutional and retail participants wish to exit volatile crypto assets without incurring the tax implications or friction of converting back to traditional fiat banking rails, they rotate capital into compliant, dollar-pegged stablecoins. Monitoring stablecoin issuance, redemption rates, and exchange inflows provides critical insight into whether capital is leaving the crypto ecosystem entirely for fiat/Treasuries or simply parking on the sidelines waiting for a dip.
Question 5: How can investors distinguish between a temporary macro-driven dip and a structural bear market reversal?
Distinguishing between a temporary liquidity-driven drawdown and a structural bear market requires monitoring breadth, on-chain accumulation metrics, and macroeconomic trend catalysts. A temporary macro dip driven by an oil shock or bond sell-off typically features resilient long-term holder accumulation, steady whale wallet clustering at key technical supports, and swift institutional re-entry once yields stabilize. Conversely, a structural bear market is characterized by sustained capital outflows from ETFs, collapsing stablecoin supply, network-wide active address declines, and a fundamental shift in central bank monetary policy toward prolonged economic contraction.